
The problem with most variance commentary
Most forecast-to-actual commentary buries the message. The pack opens with a table of actuals, forecast, and variance. Then a paragraph explains that revenue was below forecast because of lower volume, partially offset by price. By the time the reader reaches the driver, the number has already been seen and judged.
The issue is not the arithmetic. The issue is the order of presentation. Executives read variance packs the way they read anything else: top-down, looking for the one or two lines that explain the period. If the bridge is buried under a wall of numbers, the message is lost.
A better structure puts the bridge first. The bridge is the decomposition of the total variance into its drivers — volume, price, mix, timing, and one-off items. Each driver gets a dollar amount and a one-line note. The commentary then becomes two lines: what changed, and what it means.
Build the bridge before writing the commentary
The bridge is a control layer, not a formatting choice. It forces the analyst to reconcile the total variance before any narrative is written. If the bridge does not tie to the total variance, the commentary is not ready.
Start with the total variance. For a revenue line, that is actual minus forecast. Then decompose it in a fixed order:
1. Volume — units sold versus forecast units, at forecast price.
2. Price — actual price versus forecast price, at actual volume.
3. Mix — shift in product or customer mix, where the weighted average price changes even if individual prices do not.
4. Timing — revenue or cost that landed in a different period than forecast.
5. One-off items — anything outside normal operations, such as a customer settlement, a weather event, or a one-time discount.
The order matters. Volume and price are the core operating drivers. Mix is a refinement. Timing is a classification issue, not a performance issue. One-off items are excluded from the operating view. If the order is not fixed, the bridge will not be comparable month to month.
A revenue or earnings variance decomposes into volume and price effects, with mix separated where product mix shifts matter. That is the standard structure in financial analysis, and it is the structure executives expect to see.
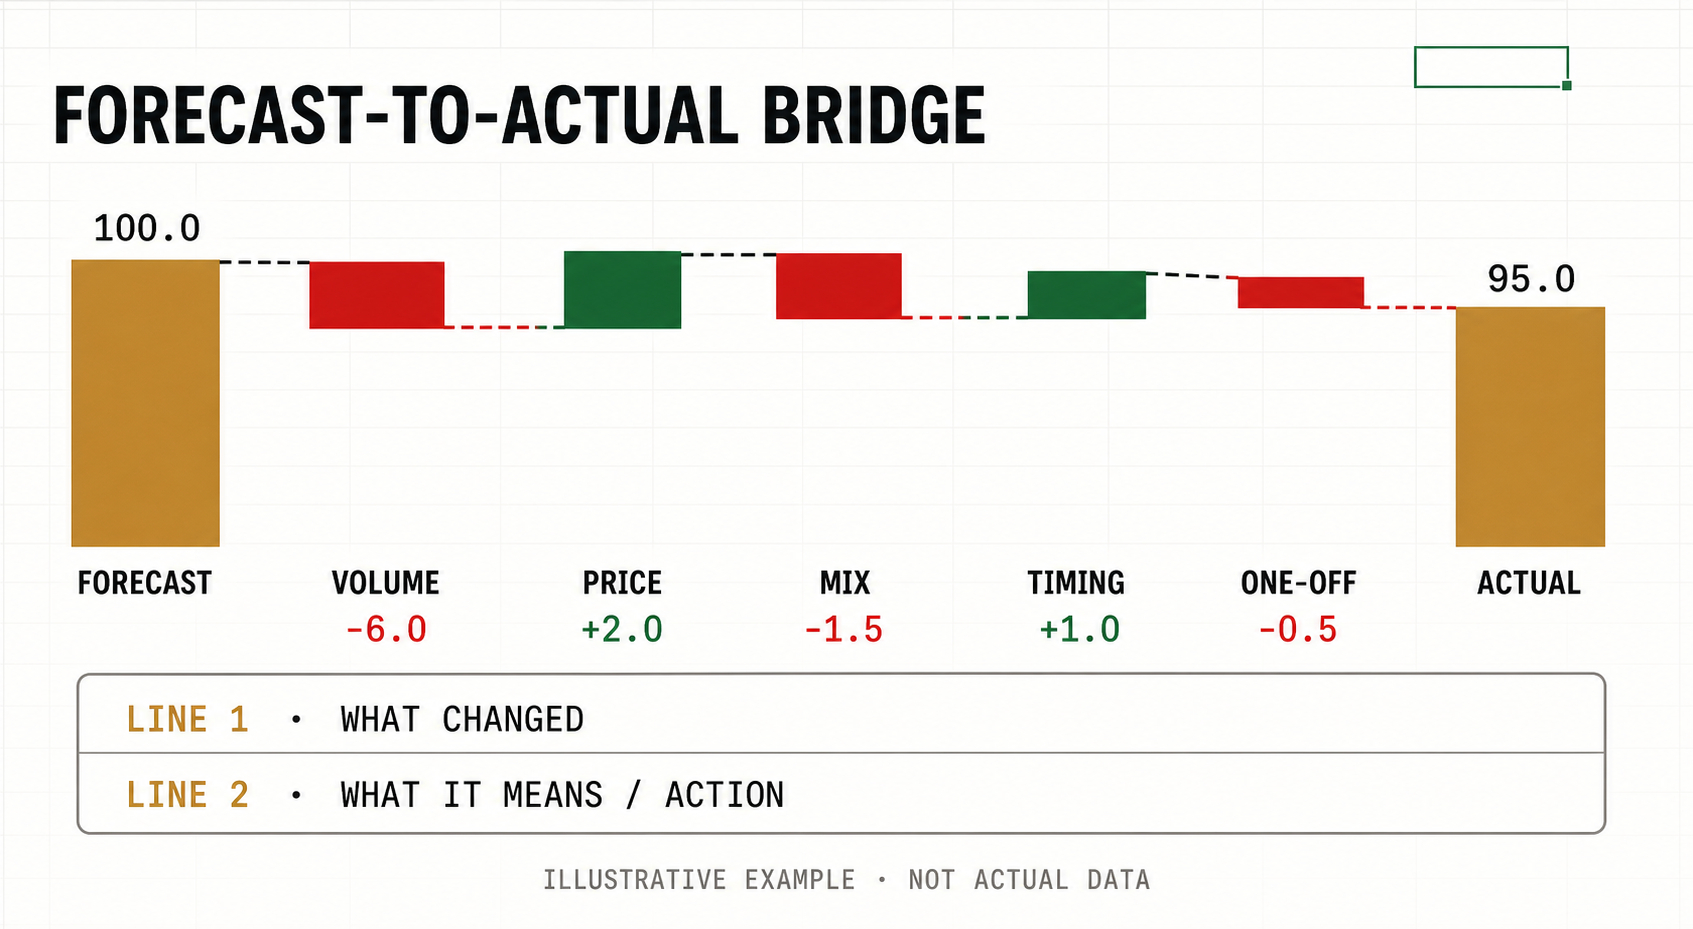
A worked example: the $1.2M revenue miss
Consider a manufacturing business with a forecast of $12.0M in revenue for the quarter. Actuals came in at $10.8M. The total variance is $1.2M unfavourable.
The bridge breaks down as follows:
Volume: -$900K. Units shipped were 8% below forecast, driven by two delayed customer orders in the industrial segment.
Price: +$150K. Realized pricing was 1.5% above forecast, mostly from lower discounting in the commercial channel.
Mix: -$300K. The product mix shifted toward lower-margin standard units, reducing the weighted average price.
Timing: -$200K. A $200K order shipped on the second day of the next quarter, not the last day of this quarter.
One-off: +$50K. A one-time expedited shipping fee from a customer was not in the forecast.
The bridge ties: -900 + 150 - 300 - 200 + 50 = -1,200, or -$1.2M.
Now the commentary. The two-line format:
Line 1: Revenue missed forecast by $1.2M, driven by lower volume (-$900K) and an unfavourable mix shift (-$300K), partially offset by stronger pricing (+$150K).
Line 2: The volume shortfall is concentrated in two delayed industrial orders now expected to ship in Q2; the mix shift reflects a one-time customer preference for standard units and is not expected to repeat.
That is the entire commentary. The bridge table sits directly above it. The executive reads the bridge, then the two lines, and has the full picture. No paragraph of context, no caveats, no buried message.
The two-line commentary discipline
The two-line format is a discipline, not a template. Line 1 states the variance and the primary drivers, in dollar terms. Line 2 states the interpretation — whether the driver is persistent, reversing, or one-time — and the action or expectation.
The discipline forces a choice. If a driver cannot be explained in one line, it is not yet understood. If the interpretation cannot be stated in one line, the analyst is still in the arithmetic stage, not the analysis stage.
Executive-facing commentary should make it clear how actual performance differed from forecast, and explanations should be understandable, clear, neutral and balanced. The two-line format is a direct response to that requirement. It removes the temptation to hedge, bury, or over-explain.
The format also changes the review process. When a pack comes back with a question, the question is usually about the bridge, not the commentary. That is the right place for the question. The bridge is the evidence; the commentary is the conclusion.
Where the pattern breaks
The limitation of this approach is that it assumes the bridge can be built cleanly. In practice, volume and price are not always separable. A discount that drives volume is both a price and a volume decision. A product mix shift can be caused by a price change in one product line. The decomposition is an accounting convention, not a physical truth.
When the drivers interact, the bridge can mislead. A $900K volume shortfall and a $150K price gain might actually be one story: the sales team held price and lost volume. The bridge shows two lines; the business reality is one decision.
This is where judgment enters. The decision is whether to present the bridge as-is, with a note on the interaction, or to restate the bridge with a combined volume-price line. The right answer depends on the audience. For an operating review, the combined line is often more honest. For a board pack, the standard decomposition is expected.
The pattern also fails when the forecast itself is not credible. If the forecast was built on a single growth rate rather than bottom-up volume and price drivers, the bridge will show a large unexplained variance. Bottom-up revenue forecasting is built on volume and average selling price drivers rather than a single growth rate. If the forecast was not built that way, the bridge will expose it — which is useful, but uncomfortable.
Operating principle
Reconciliation before presentation. The bridge must tie to the total variance before any commentary is written. If the bridge does not tie, the commentary is not ready. This is the same principle as a balance sheet tie-out: the structure is the control, and the narrative follows the structure.
Practical checklist
Build the bridge first: volume, price, mix, timing, one-off — in that order.
Tie the bridge to the total variance before writing any commentary.
Write Line 1 as the variance plus primary drivers in dollar terms.
Write Line 2 as the interpretation: persistent, reversing, or one-time, plus the action or expectation.
Place the bridge table directly above the two-line commentary.
Flag any volume-price interaction that makes the decomposition misleading.
Review the forecast quality if the bridge shows a large unexplained variance.
Sources
Practical checklist
- Build the bridge first: volume, price, mix, timing, one-off — in that order.
- Tie the bridge to the total variance before writing any commentary.
- Write Line 1 as the variance plus primary drivers in dollar terms.
- Write Line 2 as the interpretation: persistent, reversing, or one-time, plus the action or expectation.
- Place the bridge table directly above the two-line commentary.
- Flag any volume-price interaction that makes the decomposition misleading.
- Review the forecast quality if the bridge shows a large unexplained variance.